Geologic Hydrogen
Geologic hydrogen’s unique attributes make it clean and environmentally friendly.
Geologic hydrogen originates from iron-rich source rocks, which sharply contrasts with the mature, organic (carbon-rich) source rocks that generate oil and gas. As a result, geologic hydrogen can be produced with:

Low Carbon Intensity
Resulting in a low carbon footprint, on par with electrolysis.
References for Carbon Intensity
1 Carbon intensity of hydrogen production values for Central PEM (renewable), Central PEM (grid), SMR, and SMR + CCS were obtained from the 2022 GREET model.
2 The carbon intensity of hydrogen production for geologic hydrogen was calculated based on the production weighted-mean of the baseline geologic hydrogen case study reported in “Brandt, A. Greenhouse Gas Intensity of Geologic Hydrogen Produced from Subsurface Deposits. 2023. EarthArXiv preprint. https://doi.org/10.31223/X5HM1N”, excluding the global warming impact of fugitive hydrogen emissions and embodied emissions of the well casing, consistent with carbon intensity methodology calculated by GREET.

No External Water Inputs
As a primary energy source, it requires no water to support electrolysis.
References for Water Consumption
1 Water consumption factors/water intensity values for Central PEM (renewable), SMR, and SMR with CCS were obtained from the 2022 GREET model under the “WCF” tab. The water consumption factor for the central PEM using grid electricity was calculated based on summing the feedstock and fuel water consumption values in the “Hydrogen” tab (see 4.1) setting the electricity source for hydrogen production to the US average electricity mix. This value is similar to the value 27 gal/kg calculated by Webber, M. Environ. Res. Lett. 2 (2007).
2 Geologic hydrogen water consumption factor was estimated based on the production-weighted mean for the baseline scenario reported in “Brandt, A. Greenhouse Gas Intensity of Geologic Hydrogen Produced from Subsurface Deposits. 2023, preprint. EarthArXiv. https://doi.org/10.31223/X5HM1N” which represents the total produced water value.

No External Energy Inputs
As a primary energy source, it requires no electricity or heat.
References for Energy Intensity
1 Energy Intensity refers to energy supplied to produce hydrogen and does not include embedded energy for the facility.
2 Energy intensities for electrolysis, steam methane reforming, and steam methane reforming with carbon capture were obtained from GREET 2022.
3 The energy intensity of geologic hydrogen production was calculated based on the baseline scenario reported in “Brandt, A. Greenhouse Gas Intensity of Geologic Hydrogen Produced from Subsurface Deposits. 2023, preprint. EarthArXiv. https://doi.org/10.31223/X5HM1N”. The main energy inputs considered are for the reinjection compressor and gas dehydration.
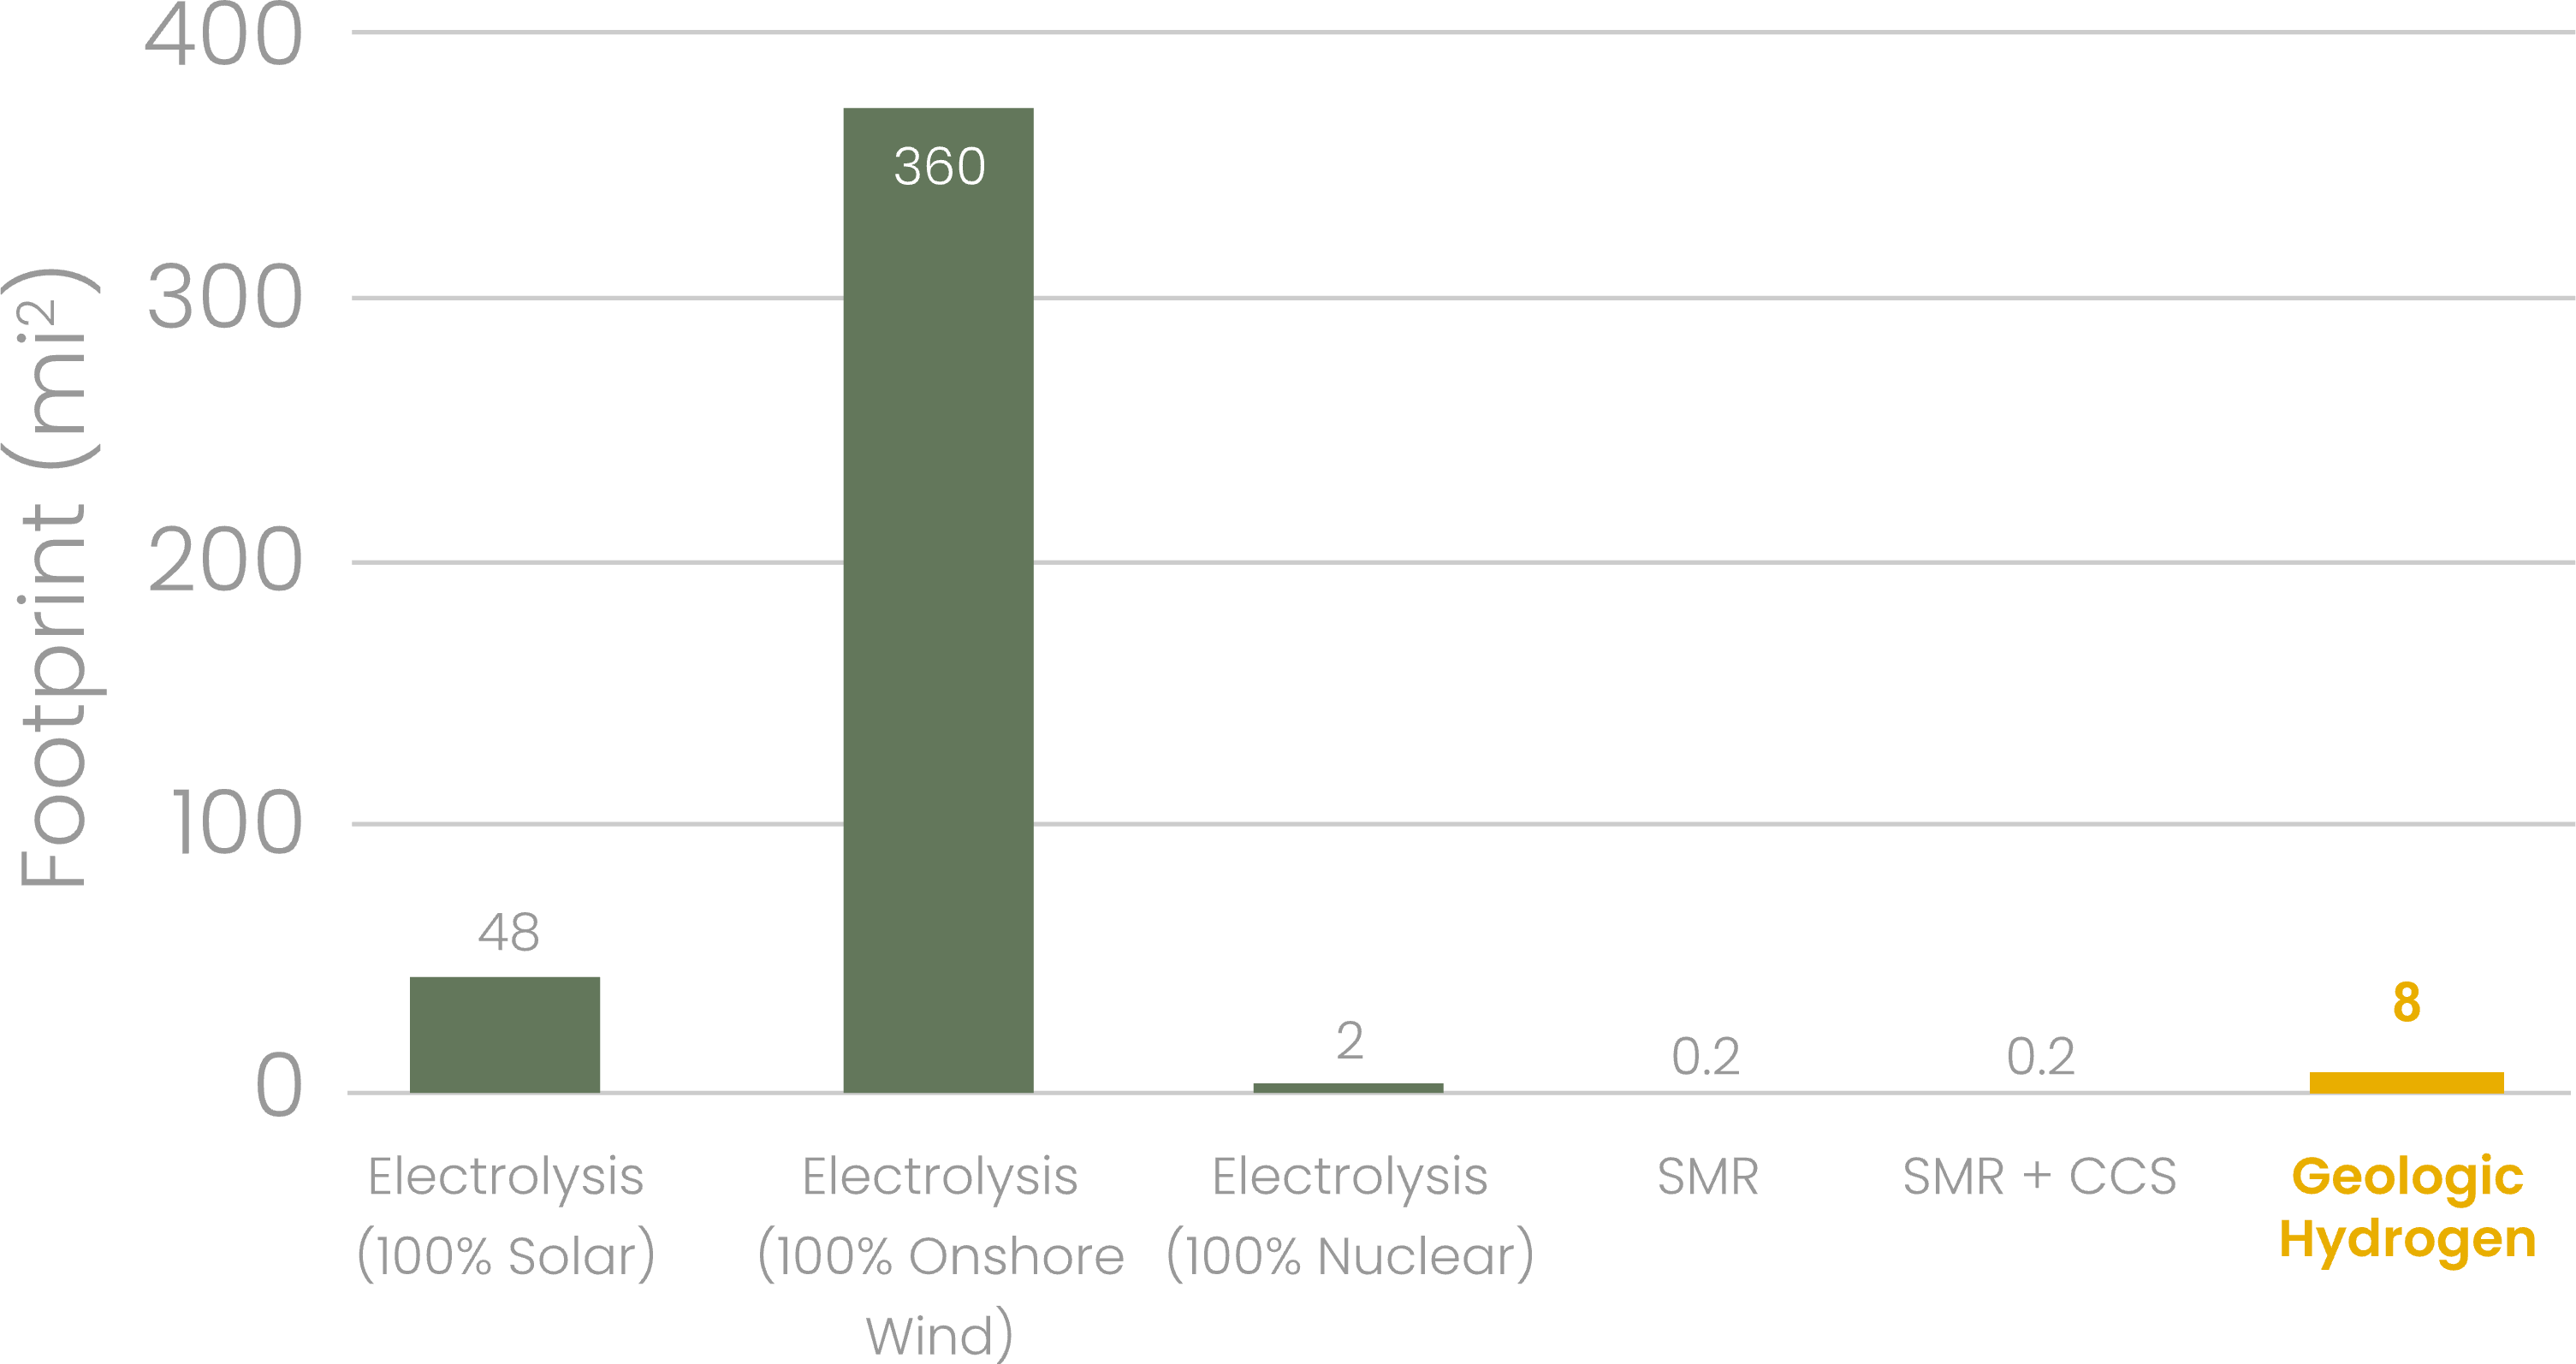
Minimal Surface Disruption
Where even a high-volume hydrogen production site is almost unnoticeable.
References for Technology Footprint
1 Yearly hydrogen production based on a commercial, state-of-the-art steam methane reformer modeled in NETL’s recent life cycle report “Comparison of Commercial, State-of-the-Art, Fossil-Based Hydrogen Production Technologies” from April 2022. Annual output from one such SMR was assumed to be 175,791,300 kgH2/year.
2 Electrolyzer efficiency assumed to be 50 kWh/kg H2. For electrolyzers supplied by 100% solar energy, it was assumed 3.5 acres/GWh/year (the solar generation-weighted average across all solar technologies) as reported in NREL’s 2013 report “Land Use Requirements for Solar Power Plants in the United States”. https://www.nrel.gov/docs/fy13osti/56290.pdf. For electrolyzers supplied by 100% wind energy, it was assumed an average of 26 acres/GWh/year, consistent with data obtained from the EIA https://www.freeingenergy.com/math/wind-land-acres-hectares-miles-m119/. For electrolyzers supplied by 100% nuclear energy, a capacity factor of 92% and 1.3 square miles per GW capacity was assumed https://www.nei.org/news/2015/land-needs-for-wind-solar-dwarf-nuclear-plants.
3 The footprint of an SMR and SMR with CCS was assumed to be 100 acres, consistent with NETL’s analysis reported in “Comparison of Commercial, State-of-the-Art, Fossil-Based Hydrogen Production Technologies” from April 2022. The footprint of the natural gas wells to produce NG for the SMR facility was calculated assuming that a natural gas well produces on average 181,647 ft3/day (https://www.eia.gov/petroleum/wells/pdf/full_report.pdf) and that 5 wells could occupy a 10-acre well pad site (https://www.e-education.psu.edu/earth109/node/941).
4 For geologic hydrogen, the footprint of a PSA unit to purify the hydrogen was assumed to be 0.3 acres (https://www.osti.gov/biblio/1090707), and a production weighted mean for the baseline scenario reported in “Brandt, A. Greenhouse Gas Intensity of Geologic Hydrogen Produced from Subsurface Deposits. 2023, preprint. EarthArXiv. https://doi.org/10.31223/X5HM1N”.
Abbreviations: SMR – Steam methane reforming, CCS – Carbon capture and sequestration